Medicare Advantage Enrollment Increases 1.6% in January 2023
Based on an analysis of CMS.gov data, the total Medicare Advantage market only grew 1.6% from December 2022 to January 2023 compared to 3.5% growth from December 2021 to January 2022.
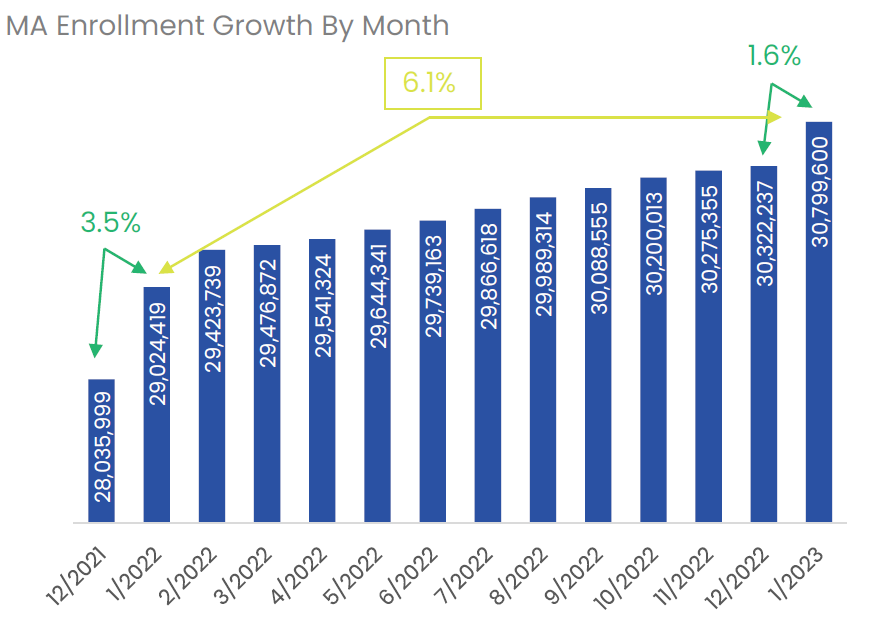
Source Data: CMS.gov
The overall growth from Jan. ‘22 to Jan. ‘23 was 6.1%, down from 9.0% (Jan. ’21 to Jan. 22), and 9.4% (Jan. ’20 to Jan. ’21). The overall growth rate continues to outpace the growth in the overall Medicare Market.

*Total MA includes Medicare-Medicaid plans, Cost plans, and PACE plans
Breaking down the Dec. ’22 to Jan. ’23 numbers a bit more:
Enrollment Type
From Dec. ‘22 to Jan. ’23:
Special Needs Plan (“SNP”) enrollment grew 5.9% (compared to 6.1% Dec. ’21 to Jan. ’22)
Non-SNP enrollment grew 0.7% (compared to 3.1% Dec. ’21 to Jan. ’22)
The majority of the slowdown happened in the non-SNP segment. The SNP segment continues to be the fastest growing segment of MA.
Employer Plan enrollment grew 0.7% (compared to 1.3% Dec. ’21 to Jan. ’22)
Individual Plan enrollment grew 1.8% (compared to 4.0% Dec. ’21 to Jan. ’22)
The majority of the slowdown happened in the Individual Plan segment.
By State
The majority of states saw an increase in enrollment from Dec. ’22 to Jan. ’23.

Source: CMS.gov
There were a few notable changes by state.
IL experienced a decrease in enrollment of 97,259 lives
CA experienced a decrease in enrollment of 47,212 lives
TX experienced an increase in enrollment of 81,134 lives
WY experienced the largest % increase of 40%
The decrease in IL and CA is likely due to CMS not renewing D-SNP “look-a-like” plans.
By Carrier
The change in enrollment varied significantly by Carrier. United Healthcare and Humana realized the largest enrollment growth, while Centene experienced the largest decrease in enrollment from Dec. ’22 to Jan. ’23.

CMS.gov
UHC experienced an increase in enrollment of 320,000 lives (a 3.8% increase – down from a 5.2% increase last year).
Humana experienced an increase in enrollment of 270,000 lives (a 5.3% increase – up from an increase of 1.6% last year).
Centene experienced a decrease of 145,000 lives (a 9.5% decrease – down from a 12.2% increase last year).
February enrollment
As you can see in the first chart above, there has historically been a large jump in enrollment from Jan. to Feb. each year. There is some speculation that the bump this year may be larger than in the past resulting in the Dec. to Feb. increase being similar to last year. Once February data is released, we will provide an updated snapshot.